

Market Summary
Global Equity
Investor confidence improves, despite lingering geopolitical risk
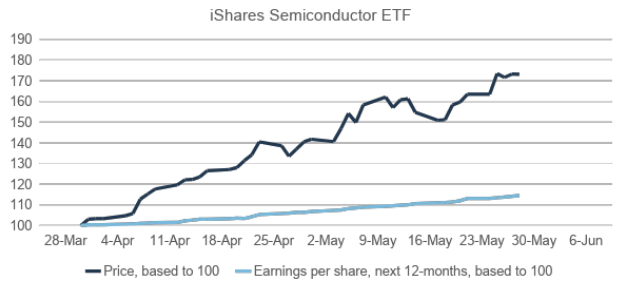
Global equities delivered a strong return of roughly +4.8% (USD-terms) in May 2026, reflecting a broadly positive global equity backdrop. Global markets advanced steadily through the month, building on momentum from April, as investor confidence improved despite lingering geopolitical risks.
However, the overall strength of the headline performance masked the fact that gains were relatively concentrated, with a narrow group of sectors and companies doing most of the heavy lifting. A central driver of this performance was the continued surge in artificial intelligence (AI)-related investments, which remained the dominant market theme. Technology equities, particularly semiconductors, memory chipmakers, and firms exposed to AI infrastructure, experienced strong demand, supported by expectations of sustained capital expenditure in AI systems. This led to significant outperformance of technology-heavy indices in the US and Asia. As a result, market leadership was relatively narrow, with non-tech sectors such as commodities and defensives lagging behind.
Another key factor was resilient corporate earnings and improving economic expectations, which reinforced investor confidence. Earnings results, particularly in the US and parts of Asia, continued to exceed expectations, underpinned by strong technology-sector profitability and broader economic resilience. At the same time, macroeconomic data supported the view that global growth would remain stable without tipping into recession, strengthening the “soft-landing” narrative. This combination of solid earnings and stable growth expectations encouraged investors to maintain exposure to equities and rotate toward higher-growth sectors.
Global Fixed Income
Volatile month for fixed income, as inflation risk ebb & flow
The global bond market, delivered a modest positive return of approximately +0.3% in May 2026. This relatively muted performance contrasts with the strong gains seen in global equities over the same period and reflects a more complex and volatile environment for fixed income. While bonds did generate positive returns, the magnitude was limited, highlighting the ongoing tension between supportive and adverse macroeconomic forces affecting global interest rates.
A key feature of May was heightened volatility in bond yields, driven largely by shifting geopolitical developments and inflation expectations. Early in the month, yields had risen sharply, particularly in major developed markets, reflecting concerns about persistent inflation and the potential for central banks to remain restrictive. However, towards the latter part of the month, yields declined as oil prices fell and geopolitical tensions, particularly in the Middle East, showed tentative signs of easing. This late-month rally in bonds helped offset earlier losses and allowed the index to finish slightly positive.
Another important driver was the interaction between inflation dynamics and monetary policy expectations. Inflation remained elevated, largely due to earlier spikes in energy prices, which initially put upward pressure on yields and capped bond returns. However, the subsequent decline in oil prices improved the inflation outlook, reducing the risk of further aggressive rate hikes. Central banks, particularly in developed markets, were expected to adopt a more cautious stance, balancing inflation risks against signs of slowing growth. This shift in expectations supported bond markets, although not strongly enough to produce large gains.
Commodities
Expectations of geopolitical de-escalation drives oil price lower
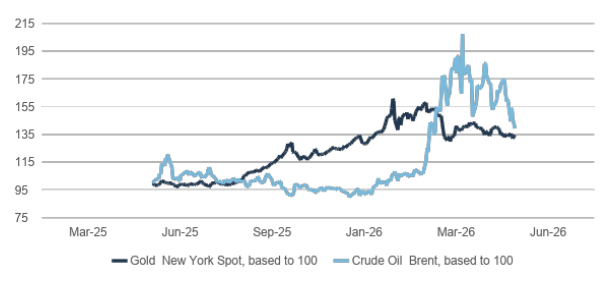
The commodity market in May 2026 was characterised by divergent performance across sectors, with energy prices declining sharply while some non‑energy commodities were more resilient. Overall, broad energy prices fell during the month, pulling down headline commodity indices, while metals showed mixed performance. This divergence reflected a shift in market dynamics from acute supply shock pricing earlier in the year toward a partial normalisation of conditions, particularly in oil markets, alongside evolving expectations for global growth, inflation, and monetary policy.
A key highlight was the significant decline in oil prices during May, with Brent crude falling by roughly 10% over the month. This reversal came after earlier spikes driven by Middle East supply disruptions and the closure of key shipping routes such as the Strait of Hormuz. As the month progressed, expectations of geopolitical de‑escalation and improved supply conditions led to a sharp pullback in prices. In addition, concerns about weaker global demand growth, particularly in Europe and China, also contributed to downward pressure on oil prices. Despite the decline, oil remained elevated in absolute terms, reflecting ongoing structural supply constraints and lingering geopolitical risk premia.
In contrast, the gold price experienced a modest decline during May, underperforming its traditional role as a safe-haven asset. The weakness in gold was primarily driven by rising real interest rates and a stronger US dollar, which increased the opportunity cost of holding non-yielding assets like gold. Importantly, the macro environment created an unusual dynamic: higher oil prices earlier in the year had pushed inflation higher, which in turn led markets to expect tighter or “higher-for-longer” monetary policy, weighing on gold demand. As a result, even ongoing geopolitical tensions did not provide sustained support to gold prices, highlighting the dominant role of monetary policy expectations.
Currencies
US Dollar gains against Japanese Yen, but weaker against SA Rand
The US dollar showed a modest strengthening bias in May 2026, particularly against the Japanese yen, while performance against the euro was more mixed and broadly stable. This reflects a combination of monetary policy divergence, inflation dynamics, and geopolitical influences, which drove currency markets during the month.
Against the euro, the dollar traded in a relatively narrow range and ended the month broadly stable. The EUR/USD rate hovered around ~1.15–1.16 (or ~0.85–0.86 EUR per USD), with only limited month-on-month movement.
In contrast, the dollar strengthened more clearly against the Japanese yen, as Japan’s exposure to higher energy prices (oil imports) and imported inflation added pressure on the currency.
Overall, the US dollar index (DXY) edged higher during May, reflecting a modest rebound in dollar strength, as sticky US inflation reinforced expectations that the Federal Reserve would keep rates elevated, supporting the dollar.
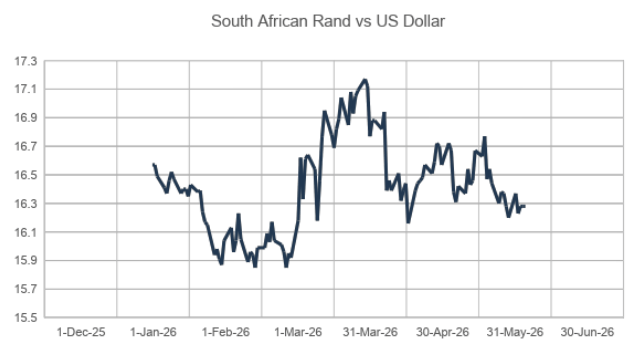
The South African Rand started the month at 16.70 to the US Dollar, and then appreciated to a level of 16.30, before risk returned to the market, and the Rand declined back to 16.77 half-way through the month. From the high of 16.77, the Rand recovered and ended the month at 16.22. The Rand continues to be driven by global risk appetite, as a resolution to the Middle East conflict remains uncertain.
South Africa
Weak consumer impact on consumer businesses
South African equities closed the month -0.3% lower. Resources ended the month in the negative, with GoldFields dropping 10% after its 7 May 2026 operational update, in which Gold Fields reported that all‑in sustaining costs for the business increased by 13% year-on-year due to cost pressures from inflation, royalties, and currency strength. A weaker oil price also resulted in Sasol declining by -12%.
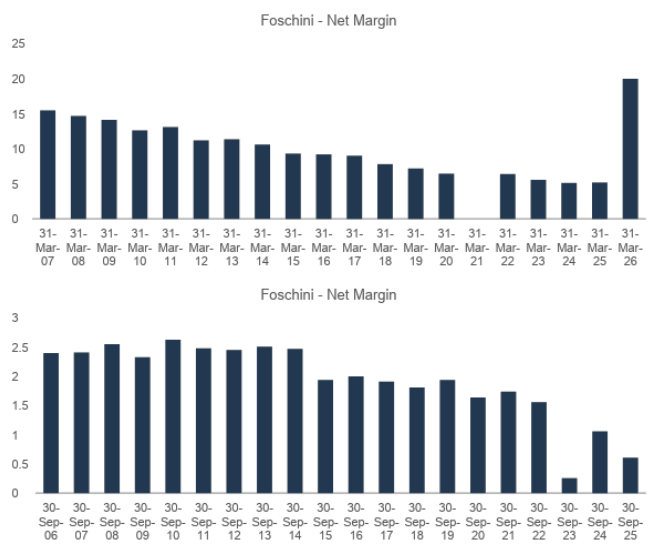
The Industrial Sector also struggled in May, with consumer stocks under pressure. Very disappointing financial updates from The Foschini Group and Spar, show their share prices falling by -18.4% and -24.6% respectively.
The Financial Sector managed to deliver positive returns, with Capitec, FirstRand and Discover leading the sector.
SA 10-year Bond yields also experienced a volatile month, reaching a high of 9.1% half-way through the month, only to end at a yield of 8.57%. With yields ending lower for the month, SA Bonds delivered a return of 2.9% for investors.
Disclaimer
The information and opinions contained in this document are recorded and expressed in good faith and in reliance on sources believed to be credible. No representation, warranty, undertaking or guarantee of whatever nature is given on the accuracy and/or completeness of such information or the correctness of such opinions. Bartizan Capital will have no liability of whatever nature and however arising in respect of any claim. damages. loss or expenses suffered directly or indirectly by the investor or the investor’s financial advisor acting on the information contained in this document. Furthermore, due to the fact that Bartizan Capital does not act as the investor’s financial advisor, they have not conducted a financial needs analysis and will rely on the needs analysis conducted by the investor’s financial advisor. Analytics recommend that investors and financial advisors take particular care to consider whether any information contained in this document is appropriate given the investor’s objectives. financial situation and particular needs in view of the fact that there may be limitations on the appropriateness of any advice provided. No guarantee of investment performance or capital protection should be inferred from any of the information contained in this document.
Bartizan Capital (Pty) Ltd is an authorised Financial Service Provider. FSP Number. 48450.